Ficheiro:Archimedean spiral polar.svg
Saltar para a navegação
Saltar para a pesquisa

Dimensões desta antevisão em PNG do ficheiro SVG: 591 × 600 píxeis Outras resoluções: 236 × 240 píxeis | 473 × 480 píxeis | 757 × 768 píxeis | 1 009 × 1 024 píxeis | 2 018 × 2 048 píxeis | 609 × 618 píxeis.
Ficheiro original (ficheiro SVG, de 609 × 618 píxeis, tamanho: 91 kB)
Descrição do ficheiro
| Descrição |
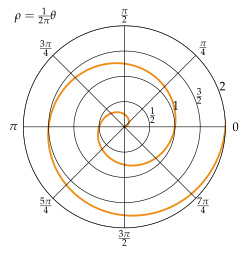
Français : Spirale d'Archimède représentée sur un graphe polaire English: Archimedean spiral represented on a polar graph |
| Data | |
| Origem | Obra do próprio |
| Autor | Guillaume Jacquenot |
Source code (Python)
# -*- coding: utf-8 -*-
#
# Script to plot an Archimedean spiral
#
# http://en.wikipedia.org/wiki/Archimedean_spiral
#
# The Archimedean spiral (also known as the arithmetic spiral
# or spiral of Archimedes) is a spiral named after the 3rd
# century BC Greek mathematician Archimedes. It is the locus
# of points corresponding to the locations over time of a
# point moving away from a fixed point with a constant speed
# along a line which rotates with constant angular velocity.
#
# Text under the
# Creative Commons Attribution-ShareAlike License
# **************************************************************
#
#
# Guillaume Jacquenot
# 2013/03/17

import numpy as np
from fractions import Fraction
import matplotlib
from matplotlib.pyplot import figure, show, rc, grid

def updateThetaAxis(ax):
    thetaFractions = [Fraction.from_float(item/np.pi) for item in ax.get_xticks()]
    labels=[]
    for f in thetaFractions:
        if f.numerator==0:
            labels.append('0')
        elif f.numerator==f.denominator:
            labels.append('\\pi')
        elif f.numerator==1:
            labels.append('\\frac{{\\pi }}{'+str(f.denominator)+'}')
        else:
            labels.append('\\frac{{'+str(f.numerator)+'\\pi }}{'+str(f.denominator)+'}')
    labels = ['$\\Large'+l+'$' for l in labels]
    ax.set_xticklabels(labels,fontsize=20)

def updateRAxis(ax):
    thetaFractions = [Fraction.from_float(item) for item in ax.get_yticks()]
    labels=[]
    for f in thetaFractions:
        if f.numerator==0:
            labels.append('0')
        elif f.numerator==f.denominator:
            labels.append('1')
        elif f.denominator==1:
            labels.append(str(f.numerator))
        else:
            labels.append('\\frac{{'+str(f.numerator)+'}}{'+str(f.denominator)+'}')
    labels = ['$'+l+'$' for l in labels]
    ax.set_yticklabels(labels,fontsize=20)

def makePlot(outputFilename = r'Archimedean_spiral_polar.svg'):
    rc('grid', linewidth=1, linestyle='-') # color='#316931'
    rc('xtick', labelsize=15)
    rc('ytick', labelsize=15)
    rc('font',**{'family':'serif','serif':['Palatino'],'size':14})
    rc('text', usetex=True)

    width, height = matplotlib.rcParams['figure.figsize']
    size = min(width, height)
    fig = figure(figsize=(size, size))
    ax = fig.add_axes([0.12, 0.12, 0.76, 0.76], polar=True, )#axisbg='#d5de9c'

    r = np.arange(0, 3.0, 0.01)
    theta = 2*np.pi*r
    ax.plot(theta, r, color='#ee8d18', lw=3)
    ax.set_rmax(2.0)
    updateThetaAxis(ax)
    updateRAxis(ax)
    grid(True)
    ax.set_title('$\\rho=\\frac{1}{2\\pi}\\theta$',fontsize=20)
    fig.savefig(outputFilename)
    fig.show()

makePlot()
Licenciamento
Eu, titular dos direitos de autor desta obra, publico-a com a seguinte licença:
A utilização deste ficheiro é regulada nos termos da licença Creative Commons - Atribuição-CompartilhaIgual 3.0 Não Adaptada.
- Pode:
- partilhar – copiar, distribuir e transmitir a obra
- recombinar – criar obras derivadas
- De acordo com as seguintes condições:
- atribuição – Tem de fazer a devida atribuição da autoria, fornecer uma hiperligação para a licença e indicar se foram feitas alterações. Pode fazê-lo de qualquer forma razoável, mas não de forma a sugerir que o licenciador o apoia ou subscreve o seu uso da obra.
- partilha nos termos da mesma licença – Se remisturar, transformar ou ampliar o conteúdo, tem de distribuir as suas contribuições com a mesma licença ou uma licença compatível com a original.
Histórico do ficheiro
Clique uma data e hora para ver o ficheiro tal como ele se encontrava nessa altura.
| Data e hora | Miniatura | Dimensões | Utilizador | Comentário | |
|---|---|---|---|---|---|
| atual | 19h17min de 18 de março de 2013 | | 609 × 618 (91 kB) | wikimediacommons>AnonMoos | move formula to side, adjust margins |
Utilização local do ficheiro
A seguinte página usa este ficheiro: