Ficheiro:MultivariateNormal.png
Saltar para a navegação
Saltar para a pesquisa
Dimensões desta antevisão: 793 × 600 píxeis. Outras resoluções: 317 × 240 píxeis | 635 × 480 píxeis | 842 × 637 píxeis.
Ficheiro original (842 × 637 píxeis, tamanho: 159 kB, tipo MIME: image/png)
Descrição do ficheiro
| Descrição |
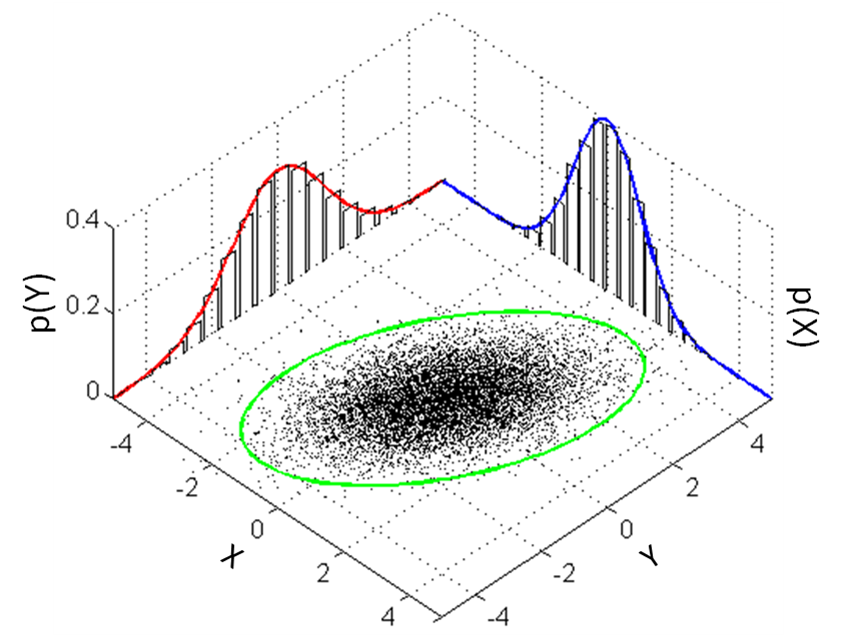
English: Illustration of a multivariate gaussian distribution and its marginals. Matlab code provided below. |
|||
| Data | ||||
| Origem | Obra do próprio | |||
| Autor | Bscan | |||
| Outras versões |
|
|||
| PNG desenvolvimento |


Source code
%This script illustrates a multivariate Gaussian distribution and its
%marginal distributions

%This code is issued under the CC0 "license"

%Define limits of plotting
X = -5:0.1:5;
Y = -5:0.1:5;

%2-d Mean and covariance matrix
MeanVec = [0 0];
CovMatrix = [1 0.6; 0.6 2];

%Get the 1-d PDFs for the "walls"
Z_x = normpdf(X,MeanVec(1), sqrt(CovMatrix(1,1)));
Z_y = normpdf(Y,MeanVec(2), sqrt(CovMatrix(2,2)));

%Get the 2-d samples for the "floor"
Samples = mvnrnd(MeanVec, CovMatrix, 10000);

%Get the sigma ellipses by transform a circle by the cholesky decomp
L = chol(CovMatrix,'lower');
t = linspace(0,2*pi,100); %Our ellipse will have 100 points on it
C = [cos(t) ; sin(t)]; %A unit circle
E1 = 1*L*C; E2 = 2*L*C; E3 = 3*L*C; %Get the 1,2, and 3-sigma ellipses

figure; hold on;
%Plot the samples on the "floor"
plot3(Samples(:,1),Samples(:,2),zeros(size(Samples,1),1),'k.','MarkerSize',2)
%Plot the 1,2, and 3-sigma ellipses slightly above the floor
%plot3(E1(1,:), E1(2,:), 1e-3+zeros(1,size(E1,2)),'Color','g','LineWidth',2);
%plot3(E2(1,:), E2(2,:), 1e-3+zeros(1,size(E2,2)),'Color','g','LineWidth',2);
plot3(E3(1,:), E3(2,:), 1e-3+zeros(1,size(E3,2)),'Color','g','LineWidth',2);

%Plot the histograms on the walls from the data in the middle
[n_x, xout] = hist(Samples(:,1),20);%Creates 20 bars
n_x = n_x ./ ( sum(n_x) *(xout(2)-xout(1)));%Normalizes to be a pdf
[~,~,~,x_Pos,x_Height] = makebars(xout,n_x);%Creates the bar points
plot3(x_Pos, Y(end)*ones(size(x_Pos)),x_Height,'-k')

%Now plot the other histograms on the wall
[n_y, yout] = hist(Samples(:,2),20);
n_y = n_y ./ ( sum(n_y) *(yout(2)-yout(1)));
[~,~,~,y_Pos,y_Height] = makebars(yout,n_y);
plot3(X(1)*ones(size(y_Pos)),y_Pos, y_Height,'-k')

%Now plot the 1-d pdfs over the histograms
plot3(X, ones(size(X))*Y(end), Z_x,'-b','LineWidth',2);
plot3(ones(size(Y))*X(1), Y, Z_y,'-r','LineWidth',2);

%Make the figure look nice
grid on; view(45,55);
axis([X(1) X(end) Y(1) Y(end)])
Licenciamento
Bscan, titular dos direitos de autor desta obra, publica-a com a seguinte licença:
| A utilização deste ficheiro é regulada nos termos Creative Commons - CC0 1.0 Dedicação Universal ao Domínio Público. | |
| A pessoa que associou uma obra a este documento dedicou-a ao domínio público, renunciando a todos os seus direitos sobre a obra em todo o mundo ao abrigo da legislação de direitos de autor, incluindo a todos os direitos legais conexos, na medida permitida por lei. Pode copiar, modificar, distribuir e executar a obra, até com fins comerciais, sem pedir autorização.
|
Histórico do ficheiro
Clique uma data e hora para ver o ficheiro tal como ele se encontrava nessa altura.
| Data e hora | Miniatura | Dimensões | Utilizador | Comentário | |
|---|---|---|---|---|---|
| atual | 20h30min de 22 de março de 2013 | | 842 × 637 (159 kB) | wikimediacommons>Bscan | User created page with UploadWizard |
Utilização local do ficheiro
A seguinte página usa este ficheiro: