Ficheiro:Population curve.svg
Saltar para a navegação
Saltar para a pesquisa

Dimensões desta antevisão em PNG do ficheiro SVG: 547 × 332 píxeis Outras resoluções: 320 × 194 píxeis | 640 × 388 píxeis | 1 024 × 622 píxeis | 1 280 × 777 píxeis | 2 560 × 1 554 píxeis.
Ficheiro original (ficheiro SVG, de 547 × 332 píxeis, tamanho: 10 kB)
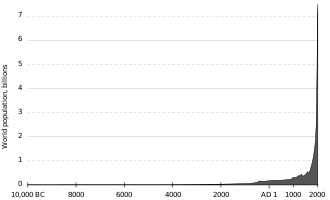
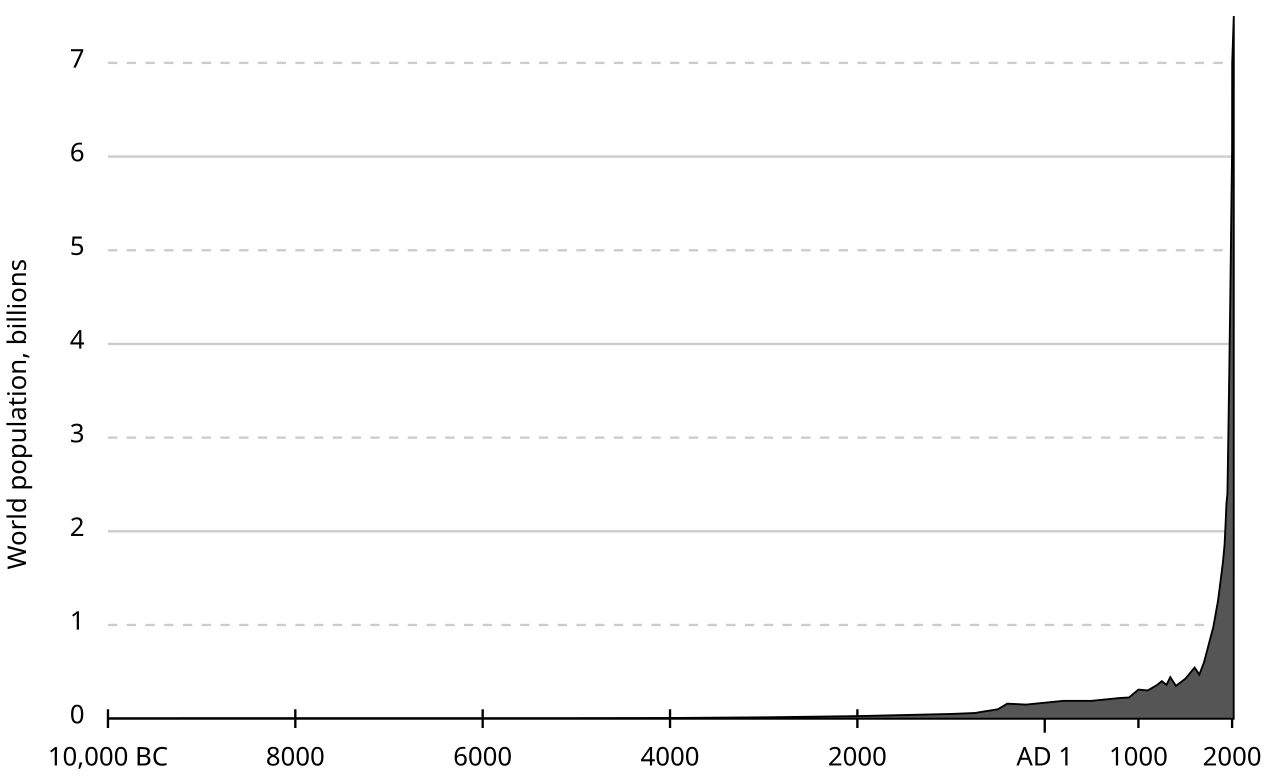
| Descrição | World human population (est.) 10,000 BCE – 2017 CE. |
| Origem | Originally uploaded to en.wikipedia as Population curve.svg. The data is from the "lower" estimates at census.gov (archive.org mirror). |
| Autor | El T |
| Outras versões | File:Population curve-ar.svg |
| Esta obra foi dedicada ao domínio público pelo autor, El T em Wikipédia em inglês, com aplicação em todo o mundo. Nalguns países isto pode não ser legalmente possível; se assim for: El T concede a todos o direito de usar esta obra para qualquer fim, sem quaisquer condições, a menos que tais condições sejam impostas por lei. |
Data
year   world population (millions)
-10000 4
-8000  5
-7000  5
-6000  5
-5000  5
-4000  7
-3000  14
-2000  27
-1000  50
-750   60
-500   100
-400   160
-200   150
1      170
200    190
400    190
500    190
600    200
700    210
800    220
900    226
1000   310
1100   301
1200   360
1250   400
1300   360
1340   443
1400   350
1500   425
1600   545
1650   470
1700   600
1750   790
1800   980
1850   1260
1900   1650
1910   1750
1920   1860
1930   2070
1940   2300
1950   2400
1960   3020
1970   3700
1974   4000
1980   4430
1987   5000
1990   5260
2000   6070
2000.5   6500     * (2000-07-02)
2000.75  6747.5   * (2000-10-02)
2001.2   7000     * (2001-03-15)
2001.3   7000.025 * (2001-04-21)
2017     7500     †

* Plotted data points added in 2012-05-24 file revision, with decimal values approximating the dates in parenthesis
† Plotted data point added in 2017-08-15 file revision (current)
Note: The above list is only meant to show the data points used to create each version of the "Population curve.svg" image and may contain inaccuracies. Refer to reputable sources for accurate population counts.
Sources
- Biraben, Jean-Noel, 1980, An Essay Concerning Mankind's Evolution, Population, Selected Papers, December, table 2.
- Durand, John D., 1974, "Historical Estimates of World Population: An Evaluation," University of Pennsylvania, Population Center, Analytical and Technical Reports, Number 10, table 2.
- Haub, Carl, 1995, "How Many People Have Ever Lived on Earth?" Population Today, February, p. 5.
- McEvedy, Colin and Richard Jones, 1978, "Atlas of World Population History," Facts on File, New York, pp. 342-351.
- Thomlinson, Ralph, 1975, "Demographic Problems, Controversy Over Population Control," Second Edition, Table 1.
- United Nations (UN), 1973, The Determinants and Consequences ofPopulation Trends, Population Studies, No. 50., p.10.
- United Nations, 1999, The World at Six Billion, Table 1, "World Population From" Year 0 to Stabilization, p. 5, http://www.un.org/esa/population/publications/sixbillion/sixbilpart1.pdf
- U.S. Census Bureau (USCB), 2008, "Total Midyear Population for the World: 1950-2050", Data updated 2008-12-15, https://www.census.gov\/ipc/www/idb/worldpop.html
- U.S. Census Bureau (USCB), 2017-08-15, "International Database (IDB)", https://www.census.gov/programs-surveys/international-programs/about/idb.html
- Note: The USCB updates the International Database annually. Data from 2018 and later is not yet reflected in this chart.
Histórico do ficheiro
Clique uma data e hora para ver o ficheiro tal como ele se encontrava nessa altura.
| Data e hora | Miniatura | Dimensões | Utilizador | Comentário | |
|---|---|---|---|---|---|
| atual | 23h24min de 15 de agosto de 2017 | | 547 × 332 (10 kB) | wikimediacommons>Gregor Hagedorn | Updating to 2017/7.5 billion |
Utilização local do ficheiro
A seguinte página usa este ficheiro: