Ficheiro:Quasiconvex function.png
Saltar para a navegação
Saltar para a pesquisa
Sem resolução maior disponível.
Quasiconvex_function.png (501 × 358 píxeis, tamanho: 11 kB, tipo MIME: image/png)
Descrição do ficheiro
| Descrição |
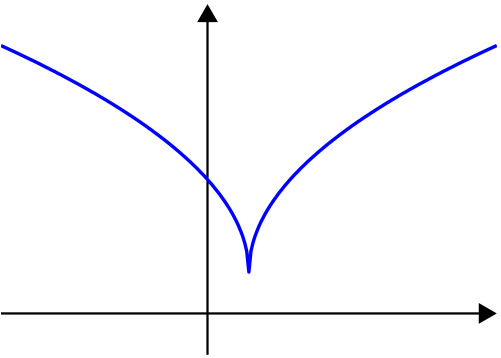
English: Quasiconvex function |
| Data | |
| Origem | Obra do próprio |
| Autor | user:Oleg Alexandrov |
| PNG desenvolvimento |
Licenciamento
| Eu, titular dos direitos de autor desta obra, dedico-a ao domínio público, com aplicação em todo o mundo. Nalguns países isto pode não ser legalmente possível; se assim for: Concedo a todos o direito de usar esta obra para qualquer fim, sem quaisquer condições, a menos que tais condições sejam impostas por lei. |
Source code (MATLAB)
function main()

% prepare the scrreen and define some parameters
clf; hold on; axis equal; axis off;
fontsize=25; thick_line=3; thin_line=2; black=[0, 0, 0]; red=[1, 0, 0];
arrowsize=0.1; arrow_type=1; arrow_angle=30; % (angle in degrees)

L=1;

X=(-L):0.01:(L+0.4);
Y=sqrt(abs(X-0.2))+0.2;

arrow([-L 0], [L+0.4, 0],          thin_line, arrowsize, arrow_angle, arrow_type, black)
arrow([0 min(Y)-0.4], [0 max(Y)+0.2], thin_line, arrowsize, arrow_angle, arrow_type, black)
plot(X, Y, 'linewidth', thick_line)

saveas(gcf, 'Quasiconvex_function.eps', 'psc2') % export to eps


function arrow(start, stop, thickness, arrow_size, sharpness, arrow_type, color)

% Function arguments:
% start, stop:  start and end coordinates of arrow, vectors of size 2
% thickness:    thickness of arrow stick
% arrow_size:   the size of the two sides of the angle in this picture ->
% sharpness:    angle between the arrow stick and arrow side, in degrees
% arrow_type:   1 for filled arrow, otherwise the arrow will be just two segments
% color:        arrow color, a vector of length three with values in [0, 1]

% convert to complex numbers
   i=sqrt(-1);
   start=start(1)+i*start(2); stop=stop(1)+i*stop(2);
   rotate_angle=exp(i*pi*sharpness/180);

% points making up the arrow tip (besides the "stop" point)
   point1 = stop - (arrow_size*rotate_angle)*(stop-start)/abs(stop-start);
   point2 = stop - (arrow_size/rotate_angle)*(stop-start)/abs(stop-start);

   if arrow_type==1 % filled arrow

      % plot the stick, but not till the end, looks bad
      t=0.5*arrow_size*cos(pi*sharpness/180)/abs(stop-start); stop1=t*start+(1-t)*stop;
      plot(real([start, stop1]), imag([start, stop1]), 'LineWidth', thickness, 'Color', color);

      % fill the arrow
      H=fill(real([stop, point1, point2]), imag([stop, point1, point2]), color);
      set(H, 'EdgeColor', 'none')

   else % two-segment arrow
      plot(real([start, stop]), imag([start, stop]),   'LineWidth', thickness, 'Color', color);
      plot(real([stop, point1]), imag([stop, point1]), 'LineWidth', thickness, 'Color', color);
      plot(real([stop, point2]), imag([stop, point2]), 'LineWidth', thickness, 'Color', color);
   end

|
Esta imagem de matemática (ou todas as imagens neste artigo ou categoria) deveriam ser recriadas usando gráficos vectoriais, como ficheiros SVG. Isto tem várias vantagens; veja as Commons:Media for cleanup|imagens para rever para mais informações. Se já criou um ficheiro SVG desta imagem, por favor, carregue-o. Depois do novo ficheiro SVG ter sido carregado, substitua aqui esta predefinição pela predefinição {{vector version available|nome da nova imagem.svg}}.
|
Histórico do ficheiro
Clique uma data e hora para ver o ficheiro tal como ele se encontrava nessa altura.
| Data e hora | Miniatura | Dimensões | Utilizador | Comentário | |
|---|---|---|---|---|---|
| atual | 20h33min de 27 de janeiro de 2007 | | 501 × 358 (11 kB) | wikimediacommons>Oleg Alexandrov | Created by myself with MATLAB. |
Utilização local do ficheiro
A seguinte página usa este ficheiro: