Ficheiro:ParisLaw.png
Saltar para a navegação
Saltar para a pesquisa
Dimensões desta antevisão: 681 × 600 píxeis. Outras resoluções: 272 × 240 píxeis | 545 × 480 píxeis | 872 × 768 píxeis | 1 162 × 1 024 píxeis | 1 429 × 1 259 píxeis.
Ficheiro original (1 429 × 1 259 píxeis, tamanho: 85 kB, tipo MIME: image/png)

|
Esta imagem de gráficos (ou todas as imagens neste artigo ou categoria) deveriam ser recriadas usando gráficos vectoriais, como ficheiros SVG. Isto tem várias vantagens; veja as Commons:Media for cleanup|imagens para rever para mais informações. Se já criou um ficheiro SVG desta imagem, por favor, carregue-o. Depois do novo ficheiro SVG ter sido carregado, substitua aqui esta predefinição pela predefinição {{vector version available|nome da nova imagem.svg}}.
|
Descrição do ficheiro
| Descrição |
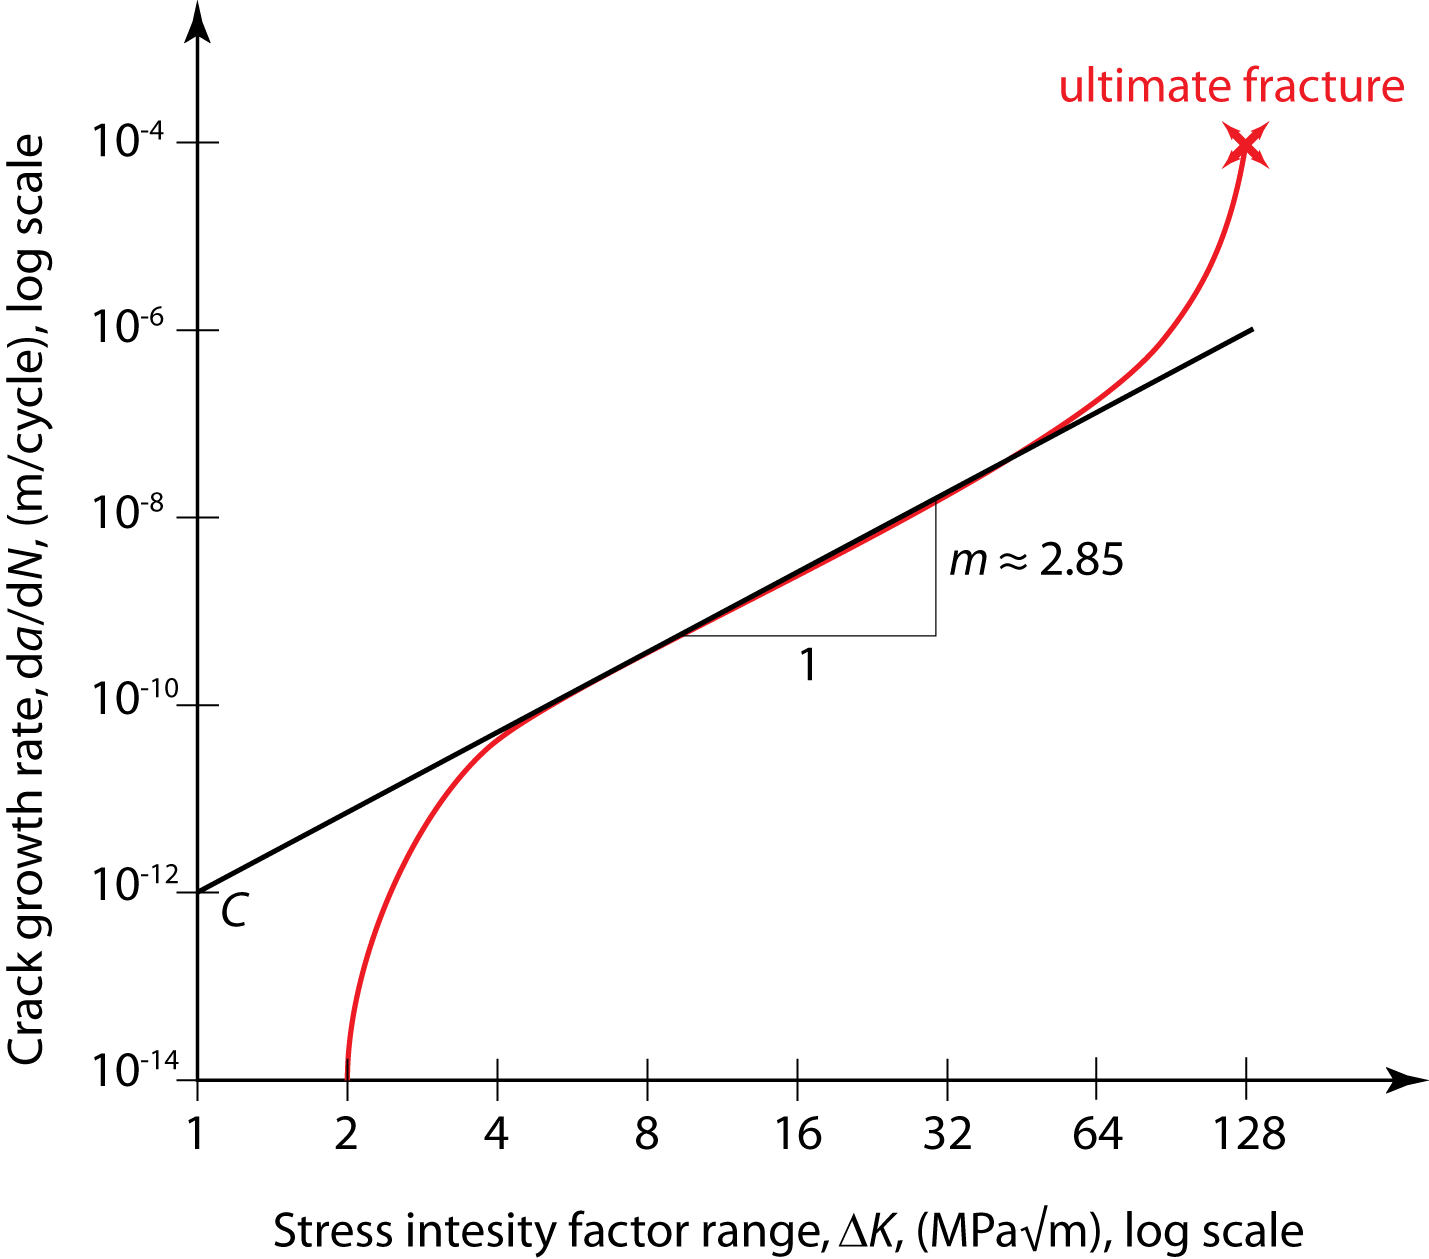
English: (Paris' law)
For a typical fatigue crack growth process, the crack growth rate is plotted over the range of the stress intensity factor (in red). Paris' law is fitted to quasi-linear part of this curve (in black). The crack growth rate, da/dN, denotes the change in crack length, a, with increasing number of load cycles, N. The range of the stress intensity factor, K, depends on the magnitude of the loading, the geometry, and the crack length. Both quantities (i.e., da/dN and K) evolve during the fatigue process until the specimen fails. On a log-log plot, the two Paris law model parameters, C and m, can be determined graphically as the y-axis intersect at x=1 and the slope, respectively. The values of the model shown here, i.e., C=10-12 and m=2.85, are typical for, e.g., aluminum. |
| Data | |
| Origem | Obra do próprio |
| Autor | Tomeasy |


Licenciamento
Eu, titular dos direitos de autor desta obra, publico-a com a seguinte licença:
A utilização deste ficheiro é regulada nos termos da licença Creative Commons - Atribuição-CompartilhaIgual 3.0 Não Adaptada.
- Pode:
- partilhar – copiar, distribuir e transmitir a obra
- recombinar – criar obras derivadas
- De acordo com as seguintes condições:
- atribuição – Tem de fazer a devida atribuição da autoria, fornecer uma hiperligação para a licença e indicar se foram feitas alterações. Pode fazê-lo de qualquer forma razoável, mas não de forma a sugerir que o licenciador o apoia ou subscreve o seu uso da obra.
- partilha nos termos da mesma licença – Se remisturar, transformar ou ampliar o conteúdo, tem de distribuir as suas contribuições com a mesma licença ou uma licença compatível com a original.
Histórico do ficheiro
Clique uma data e hora para ver o ficheiro tal como ele se encontrava nessa altura.
| Data e hora | Miniatura | Dimensões | Utilizador | Comentário | |
|---|---|---|---|---|---|
| atual | 23h35min de 22 de julho de 2010 | | 1 429 × 1 259 (85 kB) | wikimediacommons>Tomeasy | {{Information |Description={{en|1=For a typical fatigue crack growth process, the crack growth rate is plotted over the the range of the stress intensity factor (in red). Paris' law is fitted to this curve (in black). On a log-log plot, as shown here, th |
Utilização local do ficheiro
A seguinte página usa este ficheiro: